Best Visual Thinking & Diagram Tools in 2026: A Practical Comparison Review of 5 Tools

In recent years, visual thinking tools have become an essential part of how teams communicate, plan, and document ideas. From product design and software architecture to education and business strategy, diagrams are widely used to simplify complexity and improve understanding.
However, the category itself has evolved significantly. What used to be a simple “flowchart tool” space has now expanded into a broader ecosystem that includes collaborative whiteboards, AI-assisted diagram generators, workflow automation platforms, and intelligent content-to-visual systems.
Today, users are no longer just looking for tools to draw diagrams—they want faster creation, better collaboration, and smarter ways to transform information into structured visuals.
In this article, we’ll take a practical look at five widely used visual thinking tools in 2026, compare their strengths and limitations, and highlight the best scenarios for each. The goal is not to declare a single winner, but to help you choose the right tool based on your workflow.
Why Visual Thinking Tools Matter?
Visual thinking tools are not just about making diagrams look clean—they fundamentally improve how people process and communicate information.In practice, they bring several clear benefits:
- Simplify complexity: Large systems and ideas become easier to understand when broken into visual structures
- Improve communication: Teams can align faster when ideas are shown visually instead of described only in text
- Speed up decision-making: Visual context helps identify gaps, dependencies, and logic issues more quickly
- Enhance collaboration: Shared visual spaces reduce misunderstandings in cross-functional teams
Because of these benefits, visual tools have become a core part of modern product, engineering, and business workflows.

What Makes a Good Visual Thinking Tool?
Before comparing tools, it’s worth briefly defining what “good” actually means in this category. In practice, strong tools usually balance four key qualities:
- Ease of use (low learning curve, fast creation)
- Flexibility (supports different diagram types and workflows)
- Speed (quick iteration and editing)
- Clarity of output (clean, readable visuals even for complex ideas)
Tools tend to specialize in only a few of these areas, which is why different platforms serve different use cases.
A Practical Comparison of 5 Top Tools
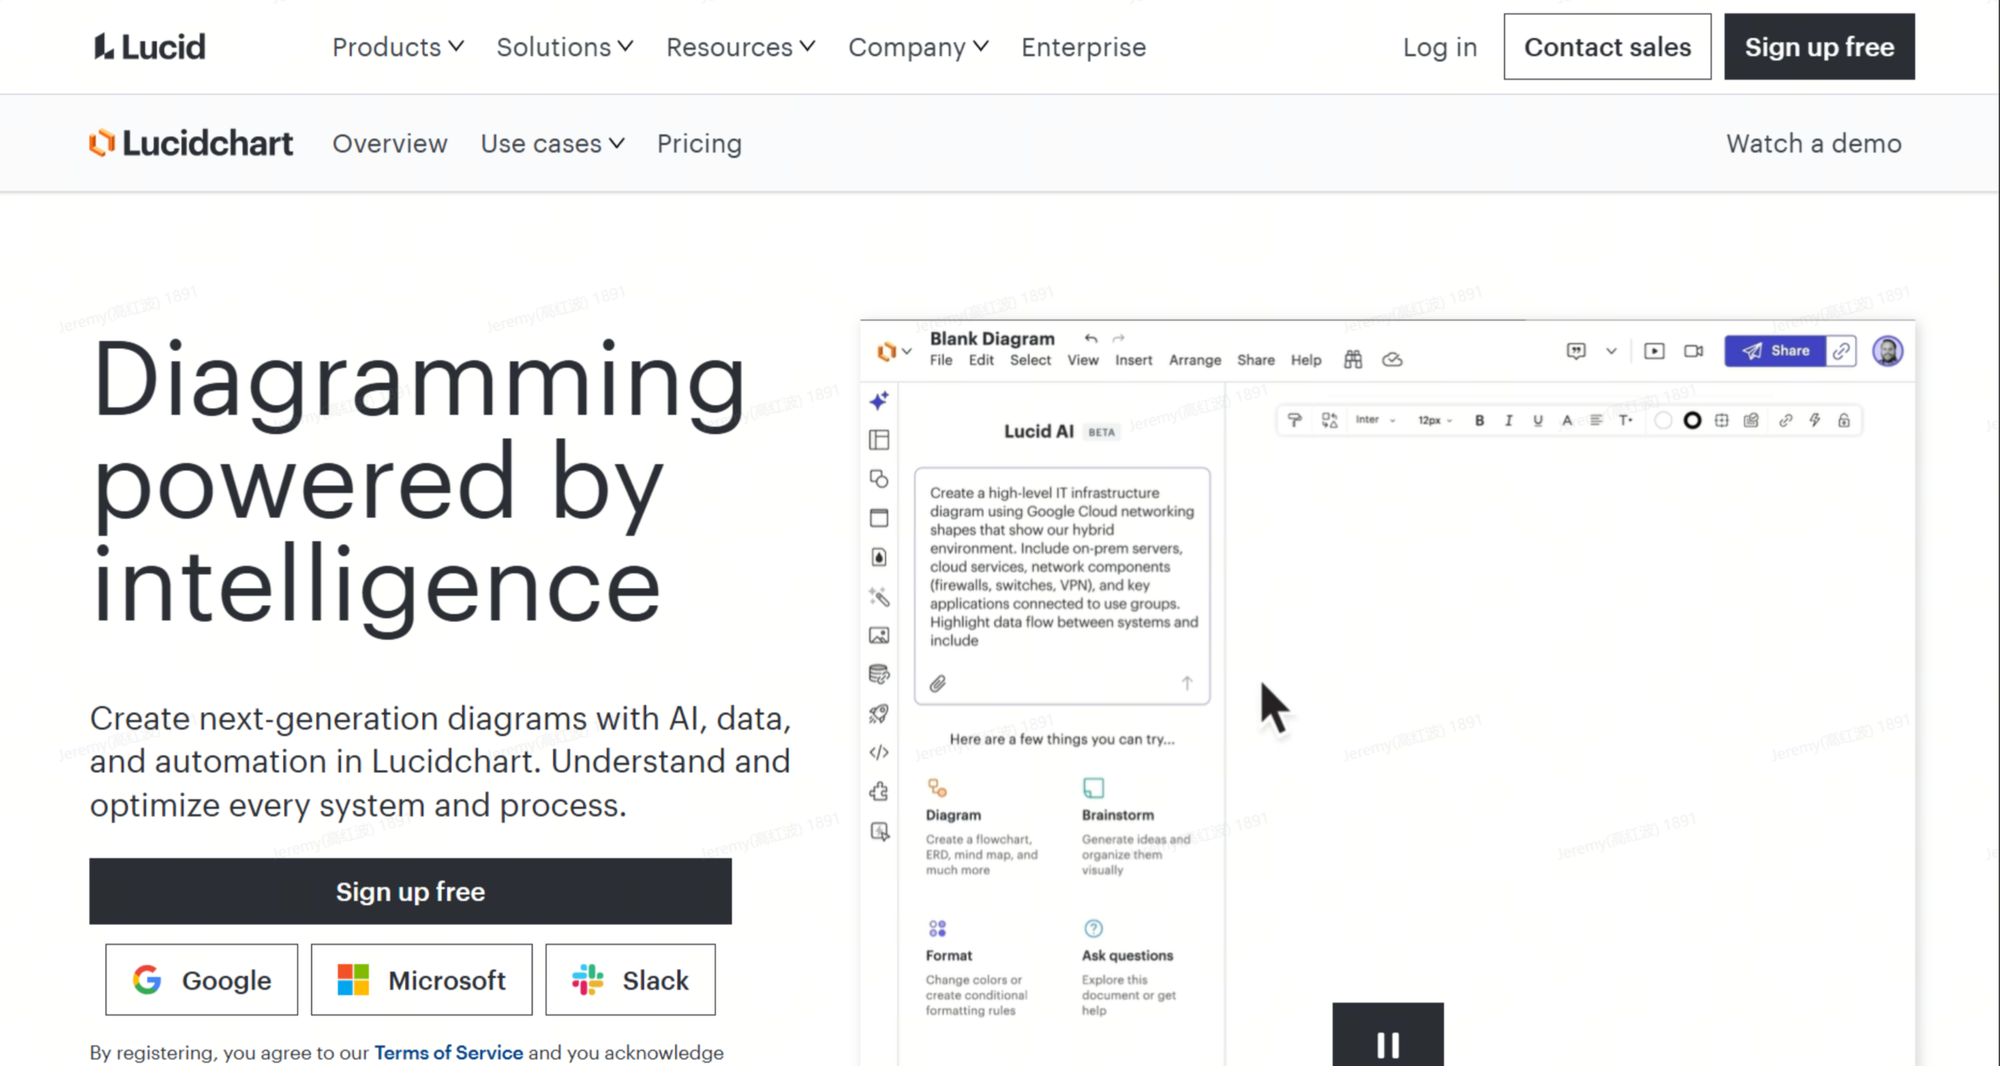
Lucidchart
Lucidchart is one of the most established diagramming tools in the enterprise space. It is widely used for structured documentation, system design, and formal process mapping.
It provides a highly controlled environment where users manually build diagrams using drag-and-drop elements. This makes it especially suitable for teams that require precision and consistency.
Pros / Cons
| Pros | Cons |
| Precise control | Fully manual |
| Enterprise-ready | Time-consuming |
| Strong integrations | Learning curve |
Best for
Enterprise architecture, formal process documentation, technical diagrams
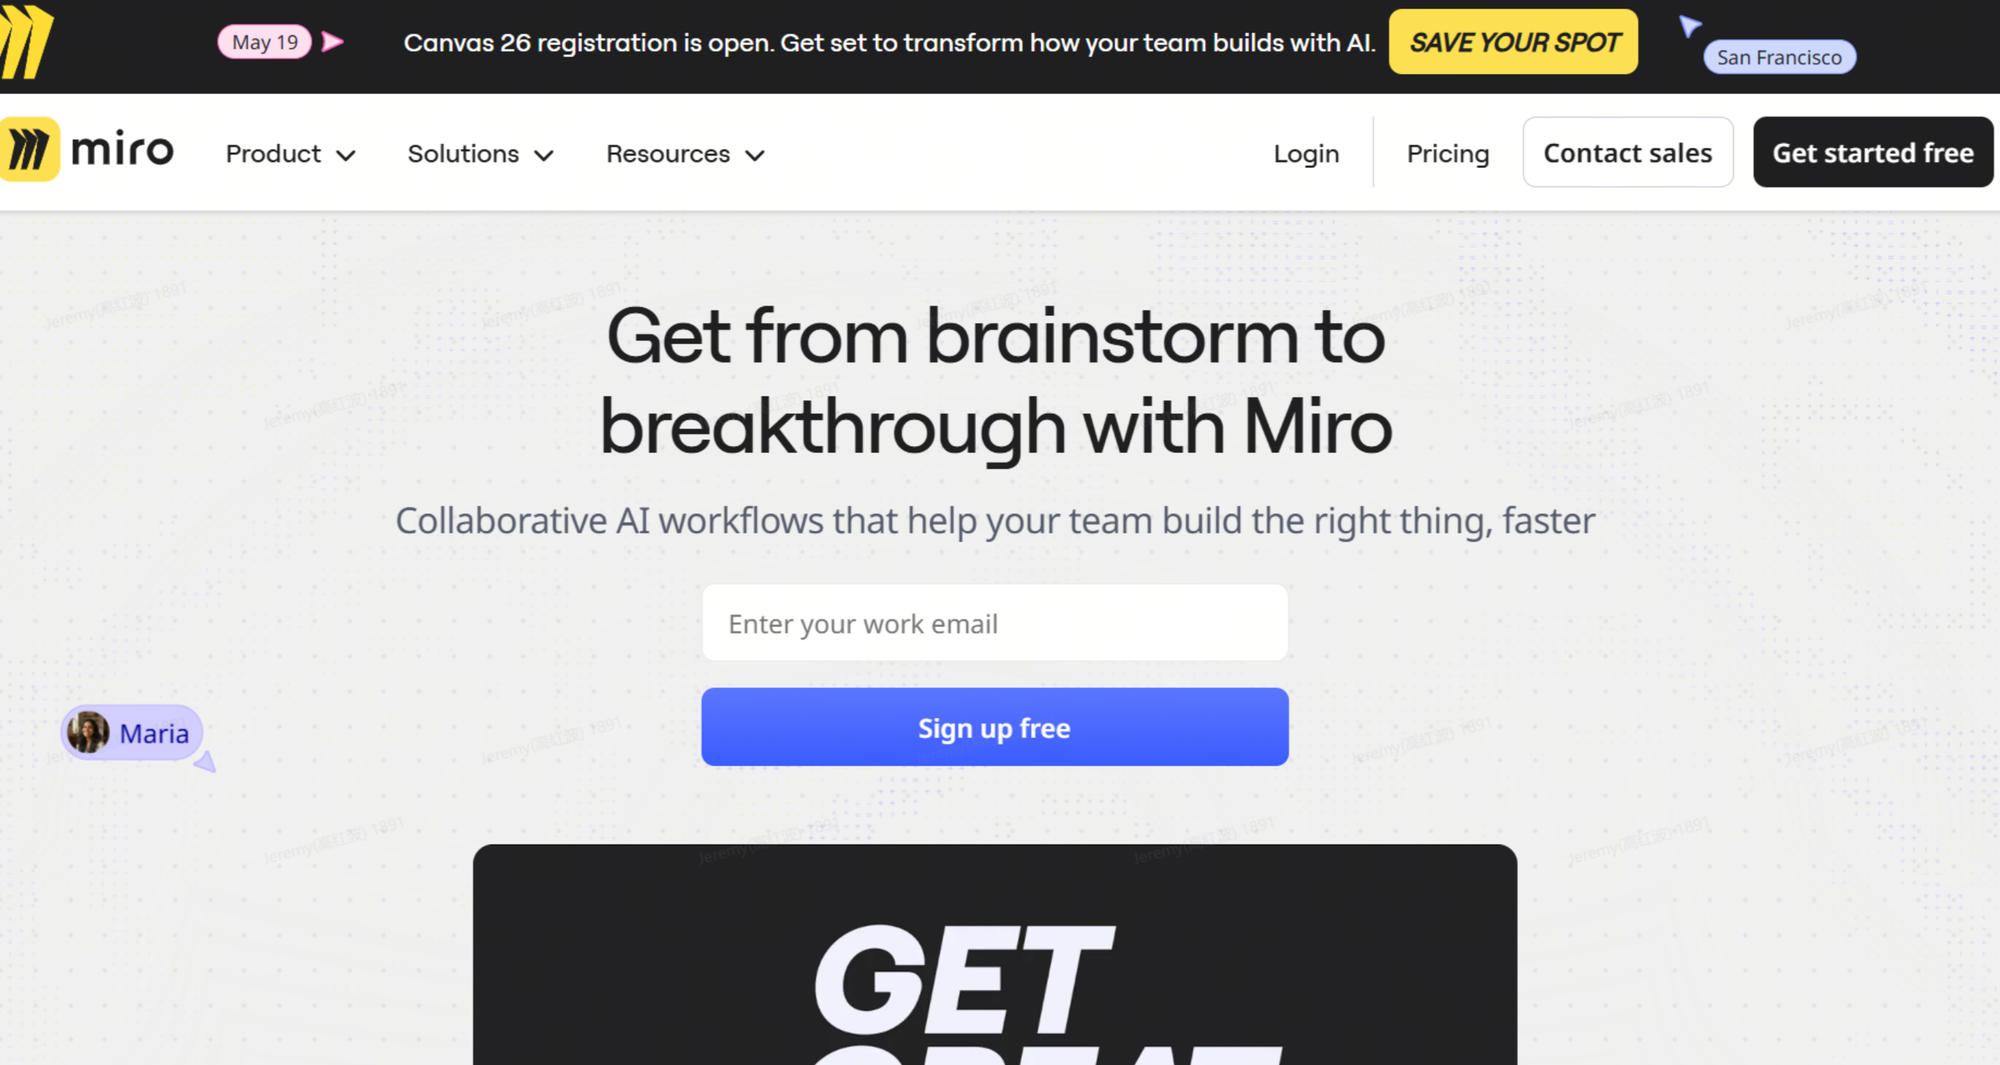
Miro
Miro is a collaborative whiteboard platform designed for real-time teamwork and ideation. Instead of focusing strictly on structured diagrams, it emphasizes flexible collaboration across teams.
It is often used in workshops, brainstorming sessions, and product discovery phases.
Pros / Cons
| Pros | Cons |
| Great collaboration | Can get messy |
| Easy teamwork | Not structured enough |
| Many templates | Limited automation |
Best for
Brainstorming, workshops, product ideation, agile planning
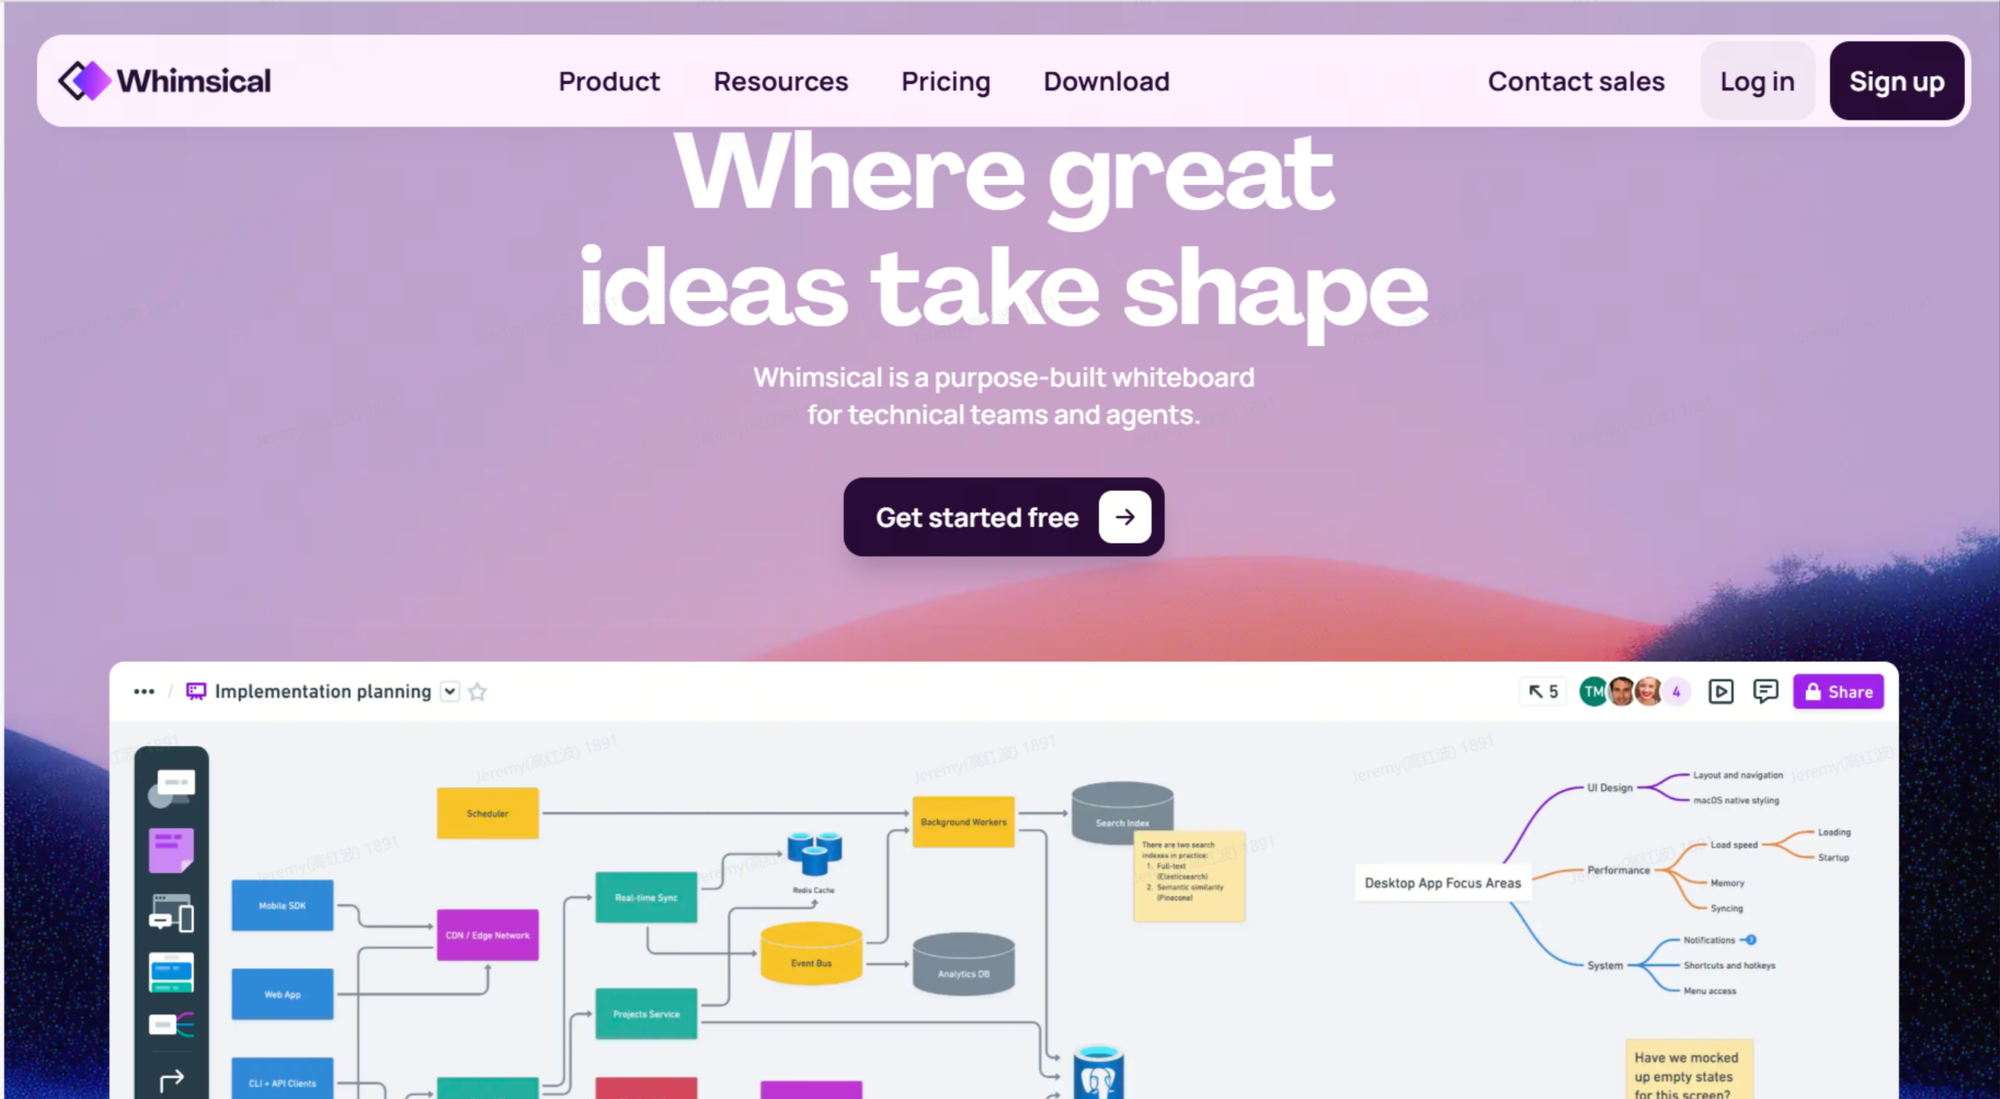
Whimsical
Miro is a collaborative whiteboard platform designed for real-time teamwork and ideation. Instead of focusing strictly on structured diagrams, it emphasizes flexible collaboration across teams.
It is often used in workshops, brainstorming sessions, and product discovery phases.
Pros / Cons
| Pros | Cons |
| Very easy to use | Limited advanced features |
| Fast diagramming | Not for complex systems |
| Clean UI | Basic AI support |
Best for
Startups, quick flows, simple wireframes, lightweight planning
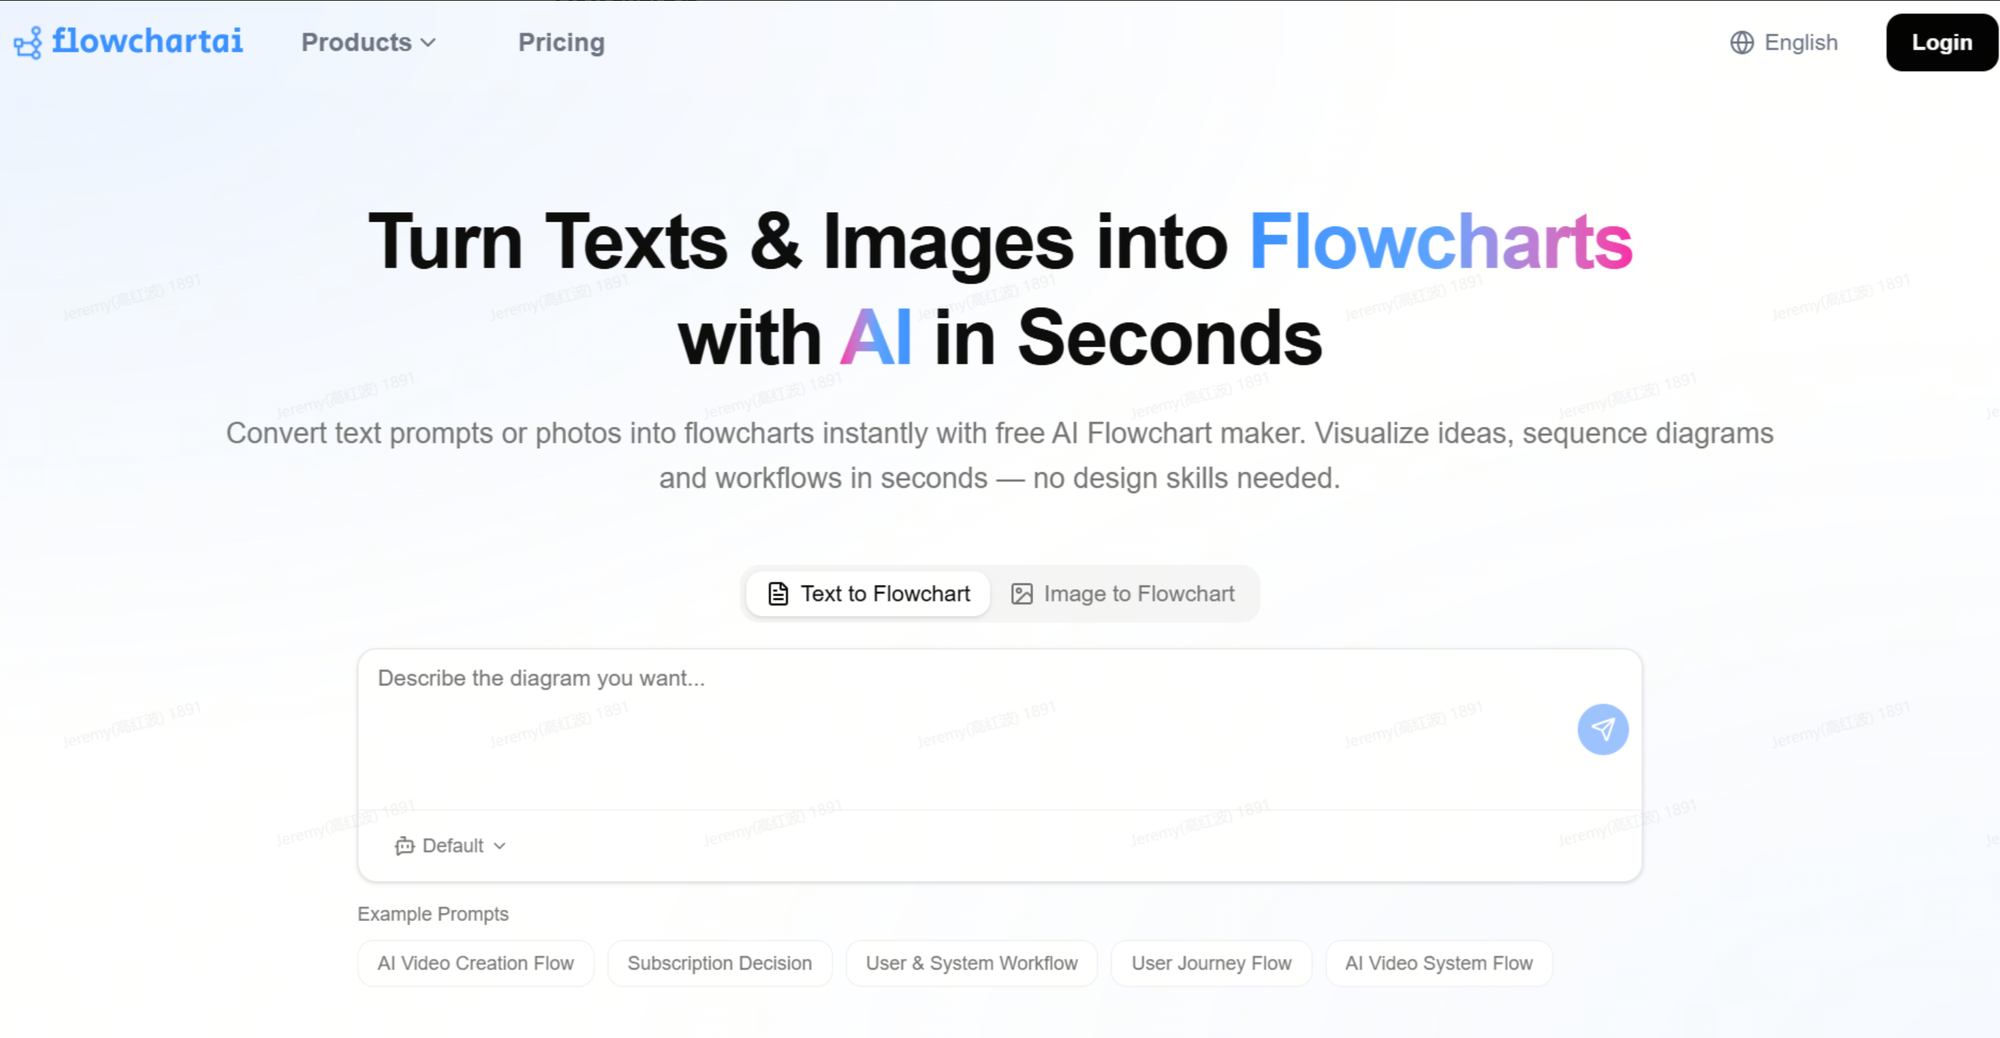
FlowChartAI
An AI-native tool that transforms raw content (documents, text, PDFs, spreadsheets, images) into structured, interactive visualizations automatically.
Pros / Cons
| Pros | Cons |
| Multi-format input | Newer ecosystem |
| Auto structure extraction | Less manual control |
| Interactive diagrams | Still evolving features |
| Fast content-to-visual conversion | Not for pixel-perfect design |
Best for
Turning documents into diagrams, summarizing reports, visualizing strategies, education, business analysis
FlowWright
FlowWright is designed less for visualization and more for execution. It allows users to build logic-based workflows that connect APIs, services, and business processes.
Although it often resemble flowcharts visually, its main purpose is automation rather than communication.

Pros / Cons
| Pros | Cons |
| Powerful automation capabilities | Not designed for visual clarity |
| Strong system integrations | Steep learning curve |
| Scalable workflows | Poor presentation use |
| Enterprise-grade logic | Overly complex for simple diagrams |
Best for
Business process automation, API orchestration, backend workflows, system integrations
Overall Comparison
| Tool | Type | Pros | Cons | Best Use |
| Lucidchart | Traditional | Precise | Manual | Enterprise diagrams |
| Miro | Collaboration | Flexible teamwork | Messy at scale | Workshops |
| Whimsical | Lightweight | Simple & fast | Limited depth | Startup planning |
| FlowChartAI | AI-native | Auto-structure + multi-input | New product category | Document-to-visual transformation |
| FlowWright | Automation | Powerful workflows | Not visual-first | Process automation |
Where Each Tool Works Best (Real-World Scenarios)
Different tools shine in different working contexts. Here are the most common real-world scenarios and what fits best:
Enterprise system design and documentation
Large organizations often need precise, standardized diagrams that follow strict structure and compliance rules.
👉 Best choice: Lucidchart
Because it offers control, consistency, and enterprise-level structure.
Team brainstorming and product discovery
When teams are exploring ideas, structure is less important than speed and collaboration.
👉 Best choice: Miro
Because it supports real-time collaboration and flexible ideation.
Startup planning and quick visualization
Early-stage teams often need something fast and lightweight without complexity.
👉 Best choice: Whimsical
Because it allows rapid diagram creation without overhead.
Business process automation and system integration
When the goal is execution rather than visualization, workflow tools are more appropriate.
👉 Best choice: FlowWright
Because it connects systems and automate processes.
Turning messy information into structured visuals
Many real-world inputs are not clean or structured—they come from documents, PDFs, spreadsheets, or mixed sources. In these cases, manual diagramming or text-based tools often require too much preparation.
👉 Best choice: FlowChartAI
Because it is designed to take raw, unstructured content and automatically convert it into structured, interactive visualizations without requiring users to manually rebuild logic.

Common Mistakes When Using Visual Thinking Tools
Before diving into the tools, it’s also important to highlight some common mistakes users make when working with diagramming and visual thinking platforms. These issues are often more impactful than tool selection itself.
Overcomplicating diagrams too early
Many users try to build a “perfect” diagram in the first attempt, adding too much detail before the structure is clear. This usually leads to cluttered visuals that are hard to understand.
Treating diagrams as final outputs instead of thinking tools
Diagrams are often most useful during exploration, not just presentation. However, many teams only use them at the end stage, missing their value in early ideation.
Mixing multiple levels of abstraction
Combining high-level strategy, mid-level processes, and low-level technical details in one diagram often creates confusion rather than clarity.
Ignoring iteration
Good visual thinking is iterative. Failing to refine diagrams over time results in outdated or misleading structures.Avoiding these mistakes often improves outcomes more than switching tools.
Frequently Asked Questions (FAQ)
What is the main difference between diagramming tools and whiteboard tools?
Diagramming tools (like Lucidchart) focus on structured, precise visuals, where layout and relationships are strictly defined. Whiteboard tools (like Miro) are more flexible and are designed for brainstorming and collaboration, even if the structure is loose or unfinished.
Do I need technical skills to use AI diagram tools?
Not necessarily. Most AI diagram tools allow you to input plain text and generate diagrams automatically. However, clearer and more structured input usually produces better results, so some basic logical structuring helps.
Are workflow automation tools the same as diagram tools?
No. Tools like FlowWright or n8n may look like flowcharts, but their primary purpose is automation, not visualization. They are designed to execute processes, not just represent them visually.
When should I avoid using traditional diagram tools?
Traditional tools can be inefficient when:
- You need to quickly process large amounts of unstructured information
- You are still in early brainstorming stages
- Your structure changes frequently
In these cases, more flexible or AI-assisted tools may be more suitable.
What type of users benefit most from visual thinking tools?
Almost every knowledge-based role benefits, including:
- Product managers
- Engineers
- Designers
- Educators
- Analysts
- Startup founders
The key is choosing the right tool for the stage of work, not just the role.
Can one tool replace all others?
In most cases, no. Each tool category serves a different purpose. Even advanced platforms are usually optimized for a specific stage such as ideation, structuring, or execution.
About the Author